Usage and Analytics
VM-X AI provides comprehensive usage tracking and analytics by aggregating
the request_audit table (Postgres) on demand. There is no separate
time-series store — audit rows are the single source of truth, and the
Usage page runs aggregate SQL (sum, avg, percentile_cont, …) over
them with per-bucket time grouping. This guide explains how to access
and use this data.
Overview
VM-X AI tracks:
- Audit Logs: Complete record of every request, with cost, tokens, custom metadata, and correlation IDs — written to the Postgres
request_audittable by the audit writer. - Usage Metrics: Aggregations over the same
request_auditrows (cost, token totals, request counts, latency percentiles) — computed on demand at query time, bucketed by the requested granularity. - Performance Metrics: Latency (p50/p95/p99), throughput, and error rates — also derived from
request_auditcolumns (request_duration,time_to_first_token,error_count,status_code).
The vmx Envelope
VM-X adds an opt-in vmx envelope to every completion request body
(Chat Completions, Anthropic Messages, Responses). It's how callers
attach metadata, override resource config, group multi-step calls,
inject provider-native fields, and bound runtime — all without
leaving the SDK shape.
{
  "model": "your-resource-name",
  "messages": [{ "role": "user", "content": "..." }],
  "vmx": {
    "correlationId": "agent-run-2026-05-06-abc123",
    "metadata": { "team": "growth", "feature": "summarizer" },
    "timeoutMs": 30000,
    "providerArgs": { "search_recency_filter": "week" },
    "secondaryModelIndex": 0,
    "resourceConfigOverrides": {
      "model": { "provider": "openai", "model": "gpt-4o-mini" }
    }
  }
}
| Field | Purpose |
|---|---|
correlationId | Free-form ID that groups related calls (e.g., a multi-step agent run). Surfaced in audit + usage UIs as a filter. |
metadata | Record<string, string> indexed for filtering. Use any keys you like — the Audit page's freeSolo autocomplete picks them up automatically. |
timeoutMs | Per-request abort cap (clamped to 10 minutes). The gateway sets up an AbortSignal.timeout that propagates all the way down to the provider SDK call, so a slow upstream stops costing you tokens. Composes with the per-model timeoutMs (whichever fires first wins). |
providerArgs | Provider-native fields that override the parsed request body. Useful when the OpenAI / Anthropic compatible shape can't express a feature your provider offers — Perplexity search_recency_filter, Anthropic top_k, Gemini safetySettings. Wins over both defaultArgs and the parsed body, even on structured fields. |
secondaryModelIndex | Skip the resource's primary model and use the Nth secondary instead (0-based). Routing is bypassed when this is set; fallback still applies. |
resourceConfigOverrides | Override the resource's primary model / connection / args / routing for this request only. Useful for A/B tests and progressive rollouts. |
The envelope works identically on /chat/completions, /anthropic/messages, and /responses.
Audit Logs
Audit logs provide a complete record of every AI request made through VM-X AI.
What's Logged
Each audit log entry includes:
- Request Details: Endpoint (chat completions / responses), model, provider, messages, parameters
- Response Details: Response content, tokens used, latency
- Cost: Per-request cost, computed from
model_pricing(prompt + completion + cached/reasoning tokens where reported by the provider) - Routing Information: Which model was used, routing decisions
- Fallback Information: Fallback attempts and results
- Capacity Information: Capacity checks and prioritization decisions
- Metadata: Request ID, correlation ID, API key, user, timestamp, and any custom key/value pairs supplied via
vmx.metadata
Accessing Audit Logs
-
Navigate to Insights → Audit in the UI
-
Use filters to find specific requests:
- Date range
- Resource
- Provider
- Model
- Status code
- API key
- User
- Correlation ID (groups multi-step calls — set via
vmx.correlationId) - Metadata Key + Value (free-text autocomplete, matches anything sent via
vmx.metadata)
-
Click on a request to view details:
- Request payload
- Response data
- Routing events
- Capacity events
- Error information
- Cost breakdown
Audit Log Fields
- id: Unique request ID
- timestamp: Request timestamp
- endpoint:
CHAT_COMPLETIONS,ANTHROPIC_MESSAGES, orRESPONSES - workspaceId: Workspace ID
- environmentId: Environment ID
- resourceId: AI Resource ID
- connectionId: AI Connection ID
- provider: Provider name
- model: Model name
- statusCode: HTTP status code
- duration: Request duration in milliseconds
- cost:
{ inputCost, outputCost, cachedCost, reasoningCost, cacheCreationCost, totalCost, currency }— see Cost Tracking - Token counts:
promptTokens,completionTokens,totalTokens, plus per-provider breakdowns:cachedTokens— input tokens read from the prompt cache (Anthropic, OpenAI)reasoningTokens— output tokens spent on internal reasoning (Anthropic extended thinking, OpenAI o-series)cacheCreationInputTokens— fresh-write cache tokens (Anthropic), with the per-TTL split:cacheCreationEphemeral5mTokens(1.25× regular input)cacheCreationEphemeral1hTokens(2× regular input)
serverToolUseWebSearchRequests/serverToolUseCodeExecutionRequests— Anthropic server tool invocationsaudioTokens,acceptedPredictionTokens,rejectedPredictionTokens— OpenAI audio output + predicted-output billingsystemFingerprint— OpenAI reproducibility identifier (when present)serviceTier— actual tier the upstream charged at (echoed by Anthropic + OpenAI)
- correlationId: Optional caller-supplied ID for grouping multi-step calls
- metadata: Optional caller-supplied
Record<string, string>indexed for filtering - requestPayload: The body the client sent (after sanitisation of multimodal bytes — see Audit + storage)
- providerRequestPayload: The body the upstream provider's SDK actually saw on the wire — captured pre-flight so it's available even when the SDK call fails. Differs from
requestPayloadwhenever the gateway converts formats (e.g. Anthropic Messages → OpenAI Chat Completions internally, or back to Anthropic for native passthrough providers). - responseData: Response data
- events: Array of events (routing, capacity, etc.)
- apiKeyId: API key used
- userId: User who made the request
- sourceIp: Source IP address
- errorMessage: Error message (if any)
- failureReason: Failure reason (if any)
Cost Tracking
Cost is derived per-request by joining the audited token usage against the
model_pricing table seeded with canonical provider rates (per 1M tokens
for prompt and completion). The breakdown is exposed both on the audit
row's Cost column and aggregated on the Usage page so you can
slice spend by resource, provider, or environment without leaving VM-X.
The breakdown carries:
| Field | What it covers |
|---|---|
inputCost | Prompt tokens at the base input rate. Cached reads and cache writes are subtracted out so they don't double-bill. |
outputCost | Completion tokens at the base output rate (excluding reasoning tokens, which bill separately). |
cachedCost | Input tokens read from the prompt cache, billed at the discounted cache-read rate. |
reasoningCost | Output tokens spent on internal reasoning (Anthropic extended thinking, OpenAI o-series). |
cacheCreationCost | Input tokens written to the prompt cache (Anthropic-only, currently). 5-minute ephemeral writes bill at 1.25× regular input; 1-hour ephemeral writes at 2×. The per-TTL split is applied automatically when the upstream reports it; otherwise the 5m multiplier is the default. |
totalCost | Sum of all of the above. |
If a model is missing from model_pricing (e.g., a brand-new release),
CostService records cost: null on the audit row (so dashboards can
distinguish "pricing not configured" from "actually zero"). Manage
entries from Settings → Pricing in the console (full CRUD, with the
rows from migration 17 prepopulated for the major providers). Newly-
added rows take effect on the next audit row written; historical rows
keep whatever cost breakdown was computed at the time they were stored.
Anthropic prompt caching — saving cost end-to-end
VM-X preserves Anthropic's cache_control markers ({ type: 'ephemeral', ttl: '5m' | '1h' }) end-to-end on Anthropic-native providers (the new native AnthropicProvider, AWS Bedrock-Invoke for Claude models). Mark the long, frozen part of your prompt with cache_control and Anthropic returns the next-run input as cached reads at ~10% of the regular input rate.
You can place markers on:
- The top-level system prompt array elements
- Individual content blocks inside
messages - Tool definitions
VM-X surfaces both the read tokens (cachedTokens) and the write tokens (cacheCreationInputTokens, with 5m / 1h split) on every audit row, and the Cost breakdown shows cacheCreationCost separately so you can verify the cache is paying off.
Where the pricing comes from
The model_pricing table is seeded by migration 17-create-model-pricing-table.ts from a bundled fallback snapshot (packages/api/src/data/pricing-fallback.json) and refreshed by PricingSyncService — a daily cron (PRICING_SYNC_CRON, default 0 3 * * *) that pulls the latest provider rates from the configured PRICING_SYNC_URL and overwrites the SYSTEM-source rows. Operator overrides written via Settings → Pricing are stored as USER-source rows and are never touched by the sync. If a sync fetch fails, the bundled fallback is used so cost calc never falls back to zero on transient errors.
Exporting Audit Logs
Audit logs can be exported for:
- Compliance requirements
- Analysis in external tools
- Backup and archival
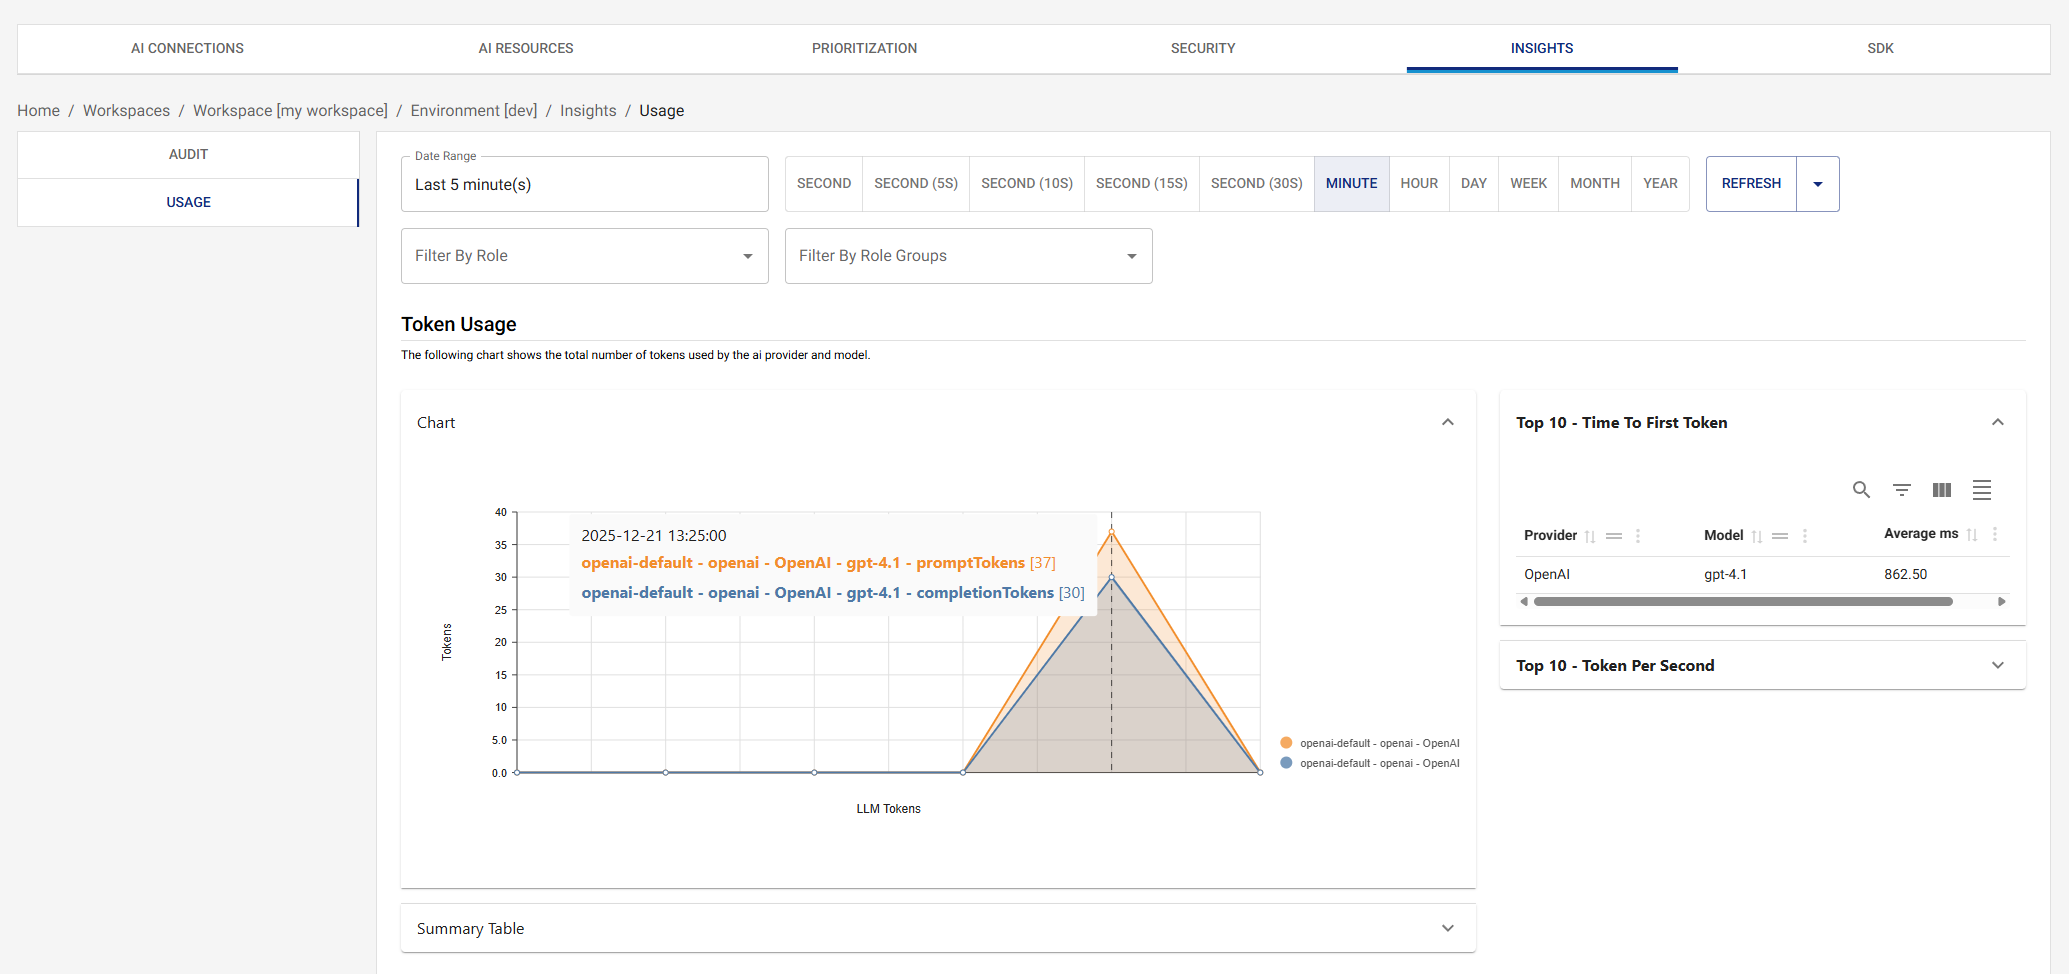
Usage Metrics
Usage metrics are computed by aggregating the Postgres request_audit
table on demand — there is no separate time-series store. The Usage
page issues a single RequestUsageQueryDto to POST /request-usage/:workspaceId/:environmentId, the API translates it into
a Kysely / SQL query against request_audit, and the results stream
back as time-bucketed rows the UI charts directly.
Metrics Tracked
The agg field of the query selects which metric columns to roll up,
and the dimensions field selects which columns to group by. The
supported metrics (CompletionMetrics) and their backing columns:
- Tokens:
promptTokens,outputTokens,totalTokens,cachedTokens,reasoningTokens - Throughput / latency:
tokensPerSecond,timeToFirstToken,requestDuration,providerDuration,gateDuration,routingDuration - Counts:
requestCount(always 1 per row),errorCount,successCount - Cost:
totalCost,inputCost,outputCost,cachedCost,reasoningCost— extracted from the per-rowcostJSONB column
Each metric supports sum / avg / min / max / p90 / p95 /
p99 aggregations (the percentile flavours map to percentile_cont
in Postgres).
Group-by dimensions
The RequestDimensions enum is the authoritative list of standard
group-by keys, all backed by indexed columns on request_audit:
workspaceId, environmentId, connectionId, resourceId, provider, model, requestId, messageId, failureReason, statusCode, correlationId, apiKeyId, sourceIp, userId.
In addition, metadataDimensions accepts dynamic metadata.<key> keys
(matching the regex ^metadata\.[\w-]+$). These are extracted at query
time via metadata->>'<key>' against the JSONB column on
request_audit, so any key you ever sent via vmx.metadata becomes a
slicing dimension automatically.
Time bucketing
granularity (GranularityUnit) picks the time bucket: second,
second_5, second_10, second_15, second_30, minute, hour,
day, week, month, year. Postgres date_trunc (or a
floor(epoch / N) * N expression for sub-minute buckets) does the
bucketing in SQL; the service then walks the bucket range client-side
to fill in zero rows for empty intervals so the chart's x-axis is
continuous.
timeZone (defaults to UTC) controls how non-UTC bucket labels are
formatted in the response.
Filtering
filter.dateRange (start inclusive, end exclusive) is required.
filter.fields is a map of dimension/metric → { operator, value },
where operator is one of eq, neq, in, nin, gt, gte, lt,
lte, is_not. Filters can be applied to standard dimensions, to
metadata.<key> keys, and to numeric metrics (e.g. totalCost gt 0).
Accessing Usage Metrics
Navigate to Usage in the UI to view:
- Cost over time, grouped by resource / provider / model / metadata
- Token usage (prompt vs output vs cached vs reasoning)
- Request counts and error rates
- Latency percentiles (p50 / p95 / p99)
Additional charts
Beyond the four core sections (Cost / Token Usage / Request details / Request Latency), the Usage page now hosts:
- Latency p50/p95/p99 over time — three-series line chart for SLO tracking. p95/p99 are what you actually page on.
- Errors by status code + errors by failure reason — stacked over time. Spot 429 spikes, 5xx incidents, and which provider was responsible.
- Top API keys by cost — bar chart of biggest spenders, descending.
- Top correlation IDs by cost — surfaces expensive multi-step agent runs (anything sharing a
vmx.correlationId). - Cost by metadata — implicit via the
Group By Metadataselector at the top of the page; every chart respects the selected metadata dimensions.
Charts marked Coming soon (fallback frequency, routing-decision distribution, cache hit rate, cost-savings vs naive baseline, concurrency-over-time) are stubbed in with their implementation notes — the slot is reserved on the page so the layout stays stable when the backend wiring lands.
Each chart has a Line/Bar toggle in its header — pick whichever representation works better for the data shape you're looking at.
OpenTelemetry Integration
Decoupled from usage analytics. OpenTelemetry, Prometheus, Loki, Jaeger, and Grafana (the optional containers in
docker-compose.yml) are for application observability of the gateway itself — request-handling latency, internal queue depths, error rates of the NestJS app and Next.js UI. They are not the source of LLM usage data. Usage and cost analytics always come from the Postgresrequest_audittable described above; the otel pipeline is purely additive and can be turned off without affecting the Audit or Usage pages.
VM-X AI exports gateway-internal metrics and traces to OpenTelemetry-compatible backends.
Metrics Exported
Every metric is prefixed with vmx.gateway. by default. The prefix is
operator-configurable via the METRICS_PREFIX env var (set
METRICS_PREFIX=acme to get acme.gateway.* instead), so VM-X metrics
can be namespaced separately when shipped to a shared OTel backend.
Counters:
| Name | Description |
|---|---|
vmx.gateway.success.count | Number of successful completions. |
vmx.gateway.error.count | Number of failed completions. Has an extra failureReason attribute. |
Histograms — tokens:
| Name | Unit | Description |
|---|---|---|
vmx.gateway.request.tokens | Prompt tokens (input). | |
vmx.gateway.response.tokens | Output tokens. | |
vmx.gateway.total.tokens | request + response. | |
vmx.gateway.cache.tokens | Cached input tokens served from prompt cache (read). Source: prompt_tokens_details.cached_tokens. Recorded only when the upstream reports the field. | |
vmx.gateway.cache.creation.tokens | Input tokens written to prompt cache (write). Source: prompt_tokens_details.cache_creation_input_tokens (Anthropic / Bedrock-Invoke). Recorded only when the upstream reports the field. | |
vmx.gateway.reasoning.tokens | Reasoning tokens (o-series, extended thinking, etc.). Source: completion_tokens_details.reasoning_tokens. Recorded only when the upstream reports the field. | |
vmx.gateway.tokens.per.second | Output throughput: total_tokens / provider_duration_seconds. |
Histograms — durations (all in ms):
| Name | Description |
|---|---|
vmx.gateway.request.duration | End-to-end request duration through the gateway. |
vmx.gateway.provider.duration | Upstream provider call duration only (excludes gate + routing). |
vmx.gateway.gate.duration | Capacity + prioritization gate evaluation duration. |
vmx.gateway.routing.duration | Routing rule evaluation duration. Only emitted when routing fires. |
vmx.gateway.time.to.first.token | Time from request acceptance to the first streamed token. Streaming requests only. |
Histogram — cost:
| Name | Unit | Description |
|---|---|---|
vmx.gateway.cost | USD | Computed request cost: input + output + cache read + cache write + reasoning, per the model-pricing table. Recorded only when pricing is known. |
Attributes (labels)
Every metric is tagged with the following attributes so you can break down dashboards by workspace, environment, model, provider, or wire format:
| Attribute | Notes |
|---|---|
workspaceId | Always set. |
environmentId | Always set. |
resourceId | The AI Resource UUID, or ephemeral for ad-hoc <connection_name>/<model> requests. |
format | Wire shape the request landed on: chat-completions, responses, or anthropic. |
provider | Upstream provider id (openai, anthropic, aws-bedrock, …). Set on per-model metrics (everything except routing). |
model | Upstream model id that actually ran. |
connectionId | UUID of the AI Connection used. |
failureReason | error.count only — parsed reason from the upstream error (e.g. rate_limit, timeout, invalid_request). |
vmx.metadata.<key> | Echo of every vmx.metadata entry on the request envelope (custom team / feature / user labels). |
Routing-duration also carries originalModel, originalProvider,
routedModel, routedProvider so you can see how often a routing rule
diverts traffic.
Traces Exported
- Request Lifecycle: Full request lifecycle
- Provider Calls: Individual provider requests
- Routing Decisions: Routing condition evaluation
- Capacity Checks: Capacity and prioritization gates
Configuring OpenTelemetry
Set environment variables:
OTEL_ENABLED=true
OTEL_EXPORTER_OTLP_ENDPOINT=http://otel-collector:4318
# Optional — override the `vmx.` prefix on every gateway metric.
# Empty / unset → `vmx`. Trailing dots are stripped.
METRICS_PREFIX=vmx
Supported Backends
- Datadog: Via OpenTelemetry collector
- Prometheus: Via OpenTelemetry collector
- Jaeger: Direct OTLP export
- AWS X-Ray: Via OpenTelemetry collector
- Any OpenTelemetry-compatible backend
Dashboard Examples
Request Volume
Track request volume over time:
- Requests per hour/day
- Requests by resource
- Requests by provider
Token Usage
Monitor token usage:
- Total tokens per period
- Prompt vs. completion tokens
- Token usage by resource
- Token usage by provider
Error Rates
Monitor error rates:
- Error rate over time
- Errors by provider
- Errors by resource
- Error types
Capacity Utilization
Track capacity usage:
- RPM utilization
- TPM utilization
- Capacity by resource
- Capacity by connection
Best Practices
1. Regular Monitoring
- Review usage metrics regularly
- Set up alerts for anomalies
- Monitor capacity utilization
- Track error rates
2. Capacity Planning
- Use historical data for capacity planning
- Identify usage patterns
- Plan for peak usage
- Adjust capacity based on trends
3. Performance Optimization
- Analyze token usage by provider and model
- Track latency percentiles (p50/p95/p99) —
requestDurationandtimeToFirstTokencolumns are what page on - Identify slow providers and route around them with secondary models / fallback
- Use
correlationIdgrouping to surface expensive multi-step agent runs
4. Compliance
- Retain audit logs as required
- Export logs for compliance
- Monitor access patterns
- Track user activity
Exporting Data
Audit Logs
Export audit logs for:
- Compliance requirements
- External analysis
- Backup and archival
Usage Metrics
Export usage metrics to:
- Business intelligence tools
- Performance analysis tools
- Custom dashboards